

Strace Tutorial for Linux Process Monitoring, Performance Troubleshooting and Debugging.
Strace is a powerful command-line tool for debugging and troubleshooting programs by capturing system calls made by a process and the signals received by the process.
How to install Strace in Debian/Ubuntu Systems?
sudo apt install strace
How to install Strace in RHEL Systems?
sudo yum install strace
Strace Examples
Strace can be triggered by simply prefixing the command with strace. For Example:
strace whoami
strace /bin/ls
Most frequently used Strace Parameters, Arguments, Flags
-p
Traces the process with given pid. For example
strace -p 12345
-f
Traces child processes spun up by parent process. Example:
strace -fp 12345
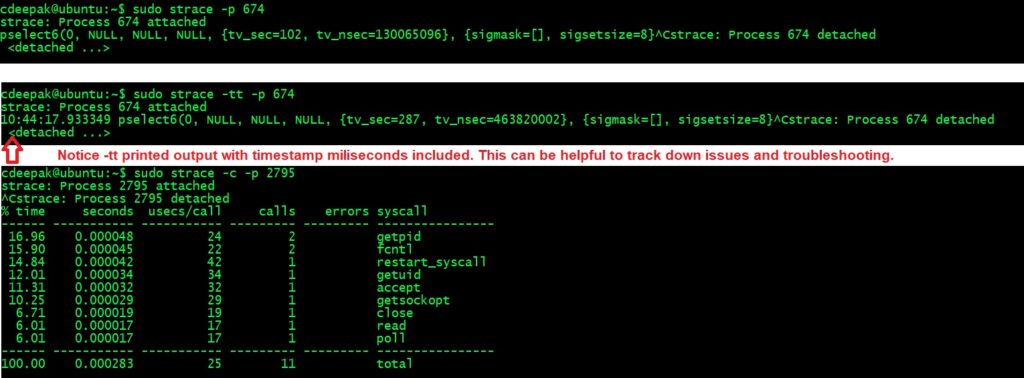
-tt
Printed timestamp includes microseconds.
strace -p 19488 -tt
-T
Prints time spent in system calls
-c
Produces strace summary
Strace troubleshooting examples
There are many other fantastic and extremely useful strace parameters available. For complete list of available arguments, refer
man strace
How to combine Strace with other commands?
Strace can be combined with other commands, scripts and programs such as awk etc. Here is one small example:
ps auxw | grep sbin/apache | awk '{print"-p " $2}' | xargs strace -v -T -ttConclusion
In times of DevOps, Site Reliability, Open Source culture where engineering, automation, performance and security is heavily looked after, Strace is extremely popular and commonly used troubleshooting, debugging utility loved by Engineers and Software Developers in Linux world. In this article we tried to cover different usages of this awesome utility. Hope this has been helpful. Please write down in comment section or get in touch if you want us to cover any specific Strace functionality. Alternatively you may found this article helpful.
Thank you
🙂